Spot the NOT
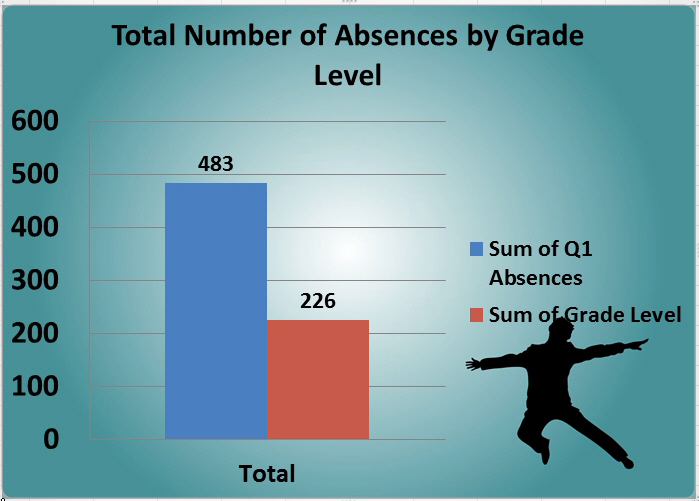
 The first slide in this report accidentally includes a SUM of grade level which really does not make any sense:

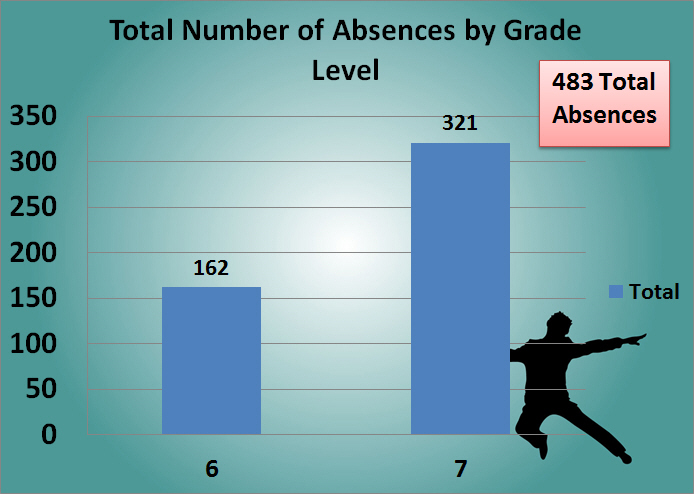
Instead, the report should have included Q1 absences disaggregated by grade level (see below):

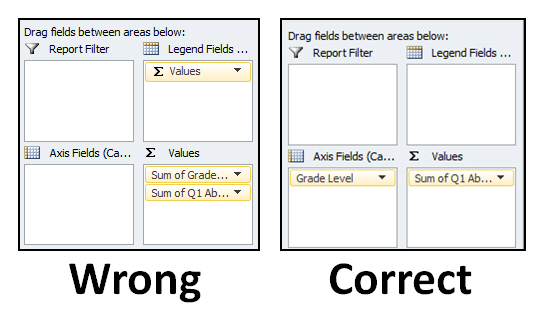
This mistake was made when using pivot tables and not checking to see if the variable is in the right spot (Axis Field versus Values). In this case, Grade Level was placed in the Values field by default and needed to be moved to the Axis Field.
